
Reports and Insights
Open Reports in the sidebar. Across the top you'll switch between the Reports tab and the Insights tab.
1. The Reports tab — printable lists and PDFs
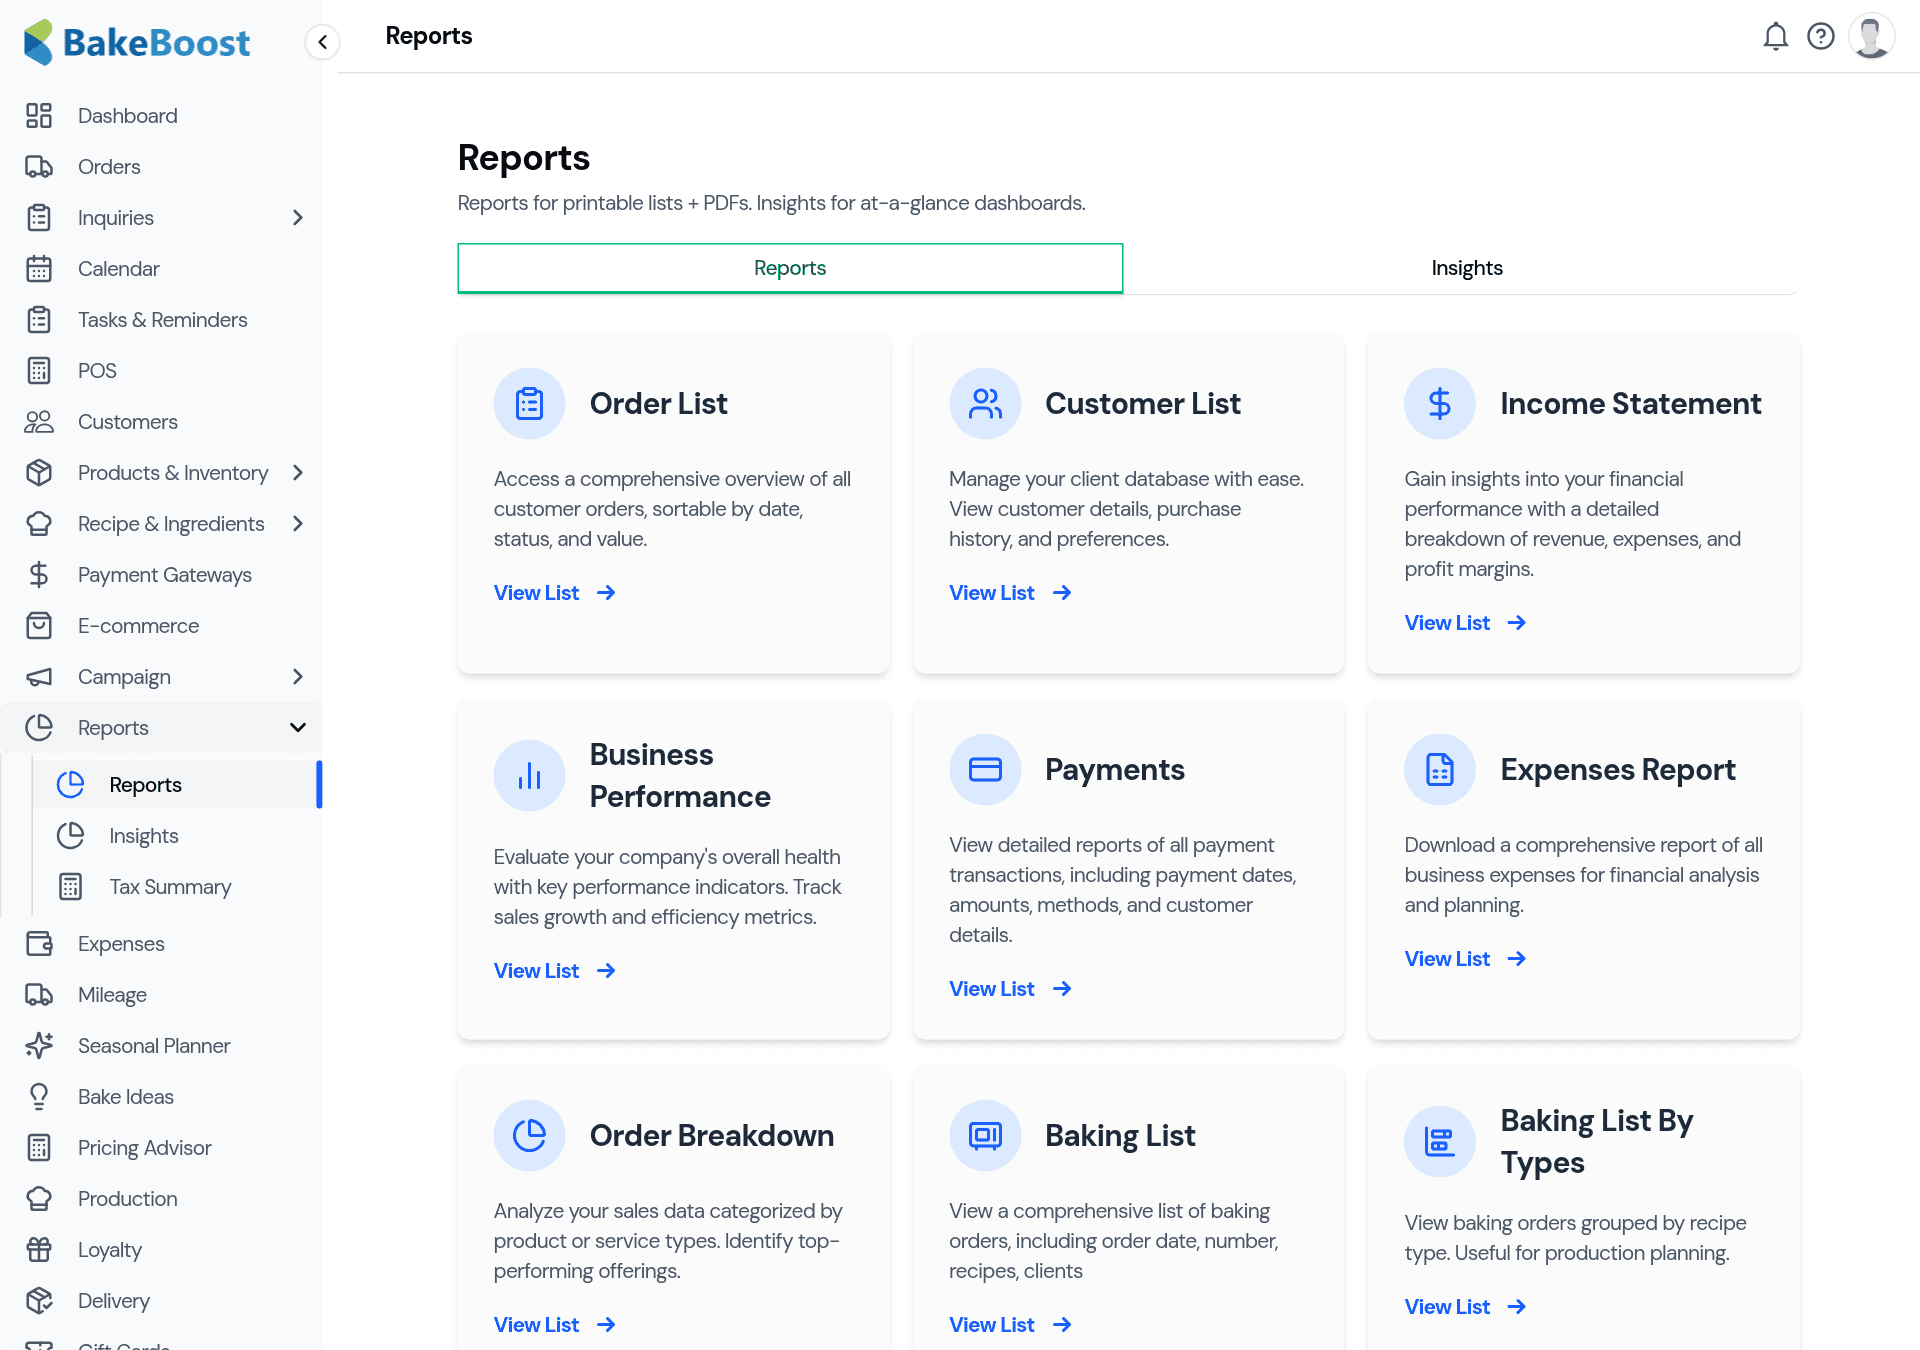
Each card opens a focused report you can filter by date and export or print. The ones you'll reach for most:
- Order List — every order, sortable and filterable by date, status or customer.
- Income Statement — your revenue, expenses and profit for a period.
- Payments — all payments taken, with dates, methods and customers.
- Expenses Report — a full breakdown of spending for your records.
- Order Breakdown — sales grouped by product, so you can see your top sellers.
- Baking lists & shopping lists — production-side reports for what to bake and buy.
Income Statement
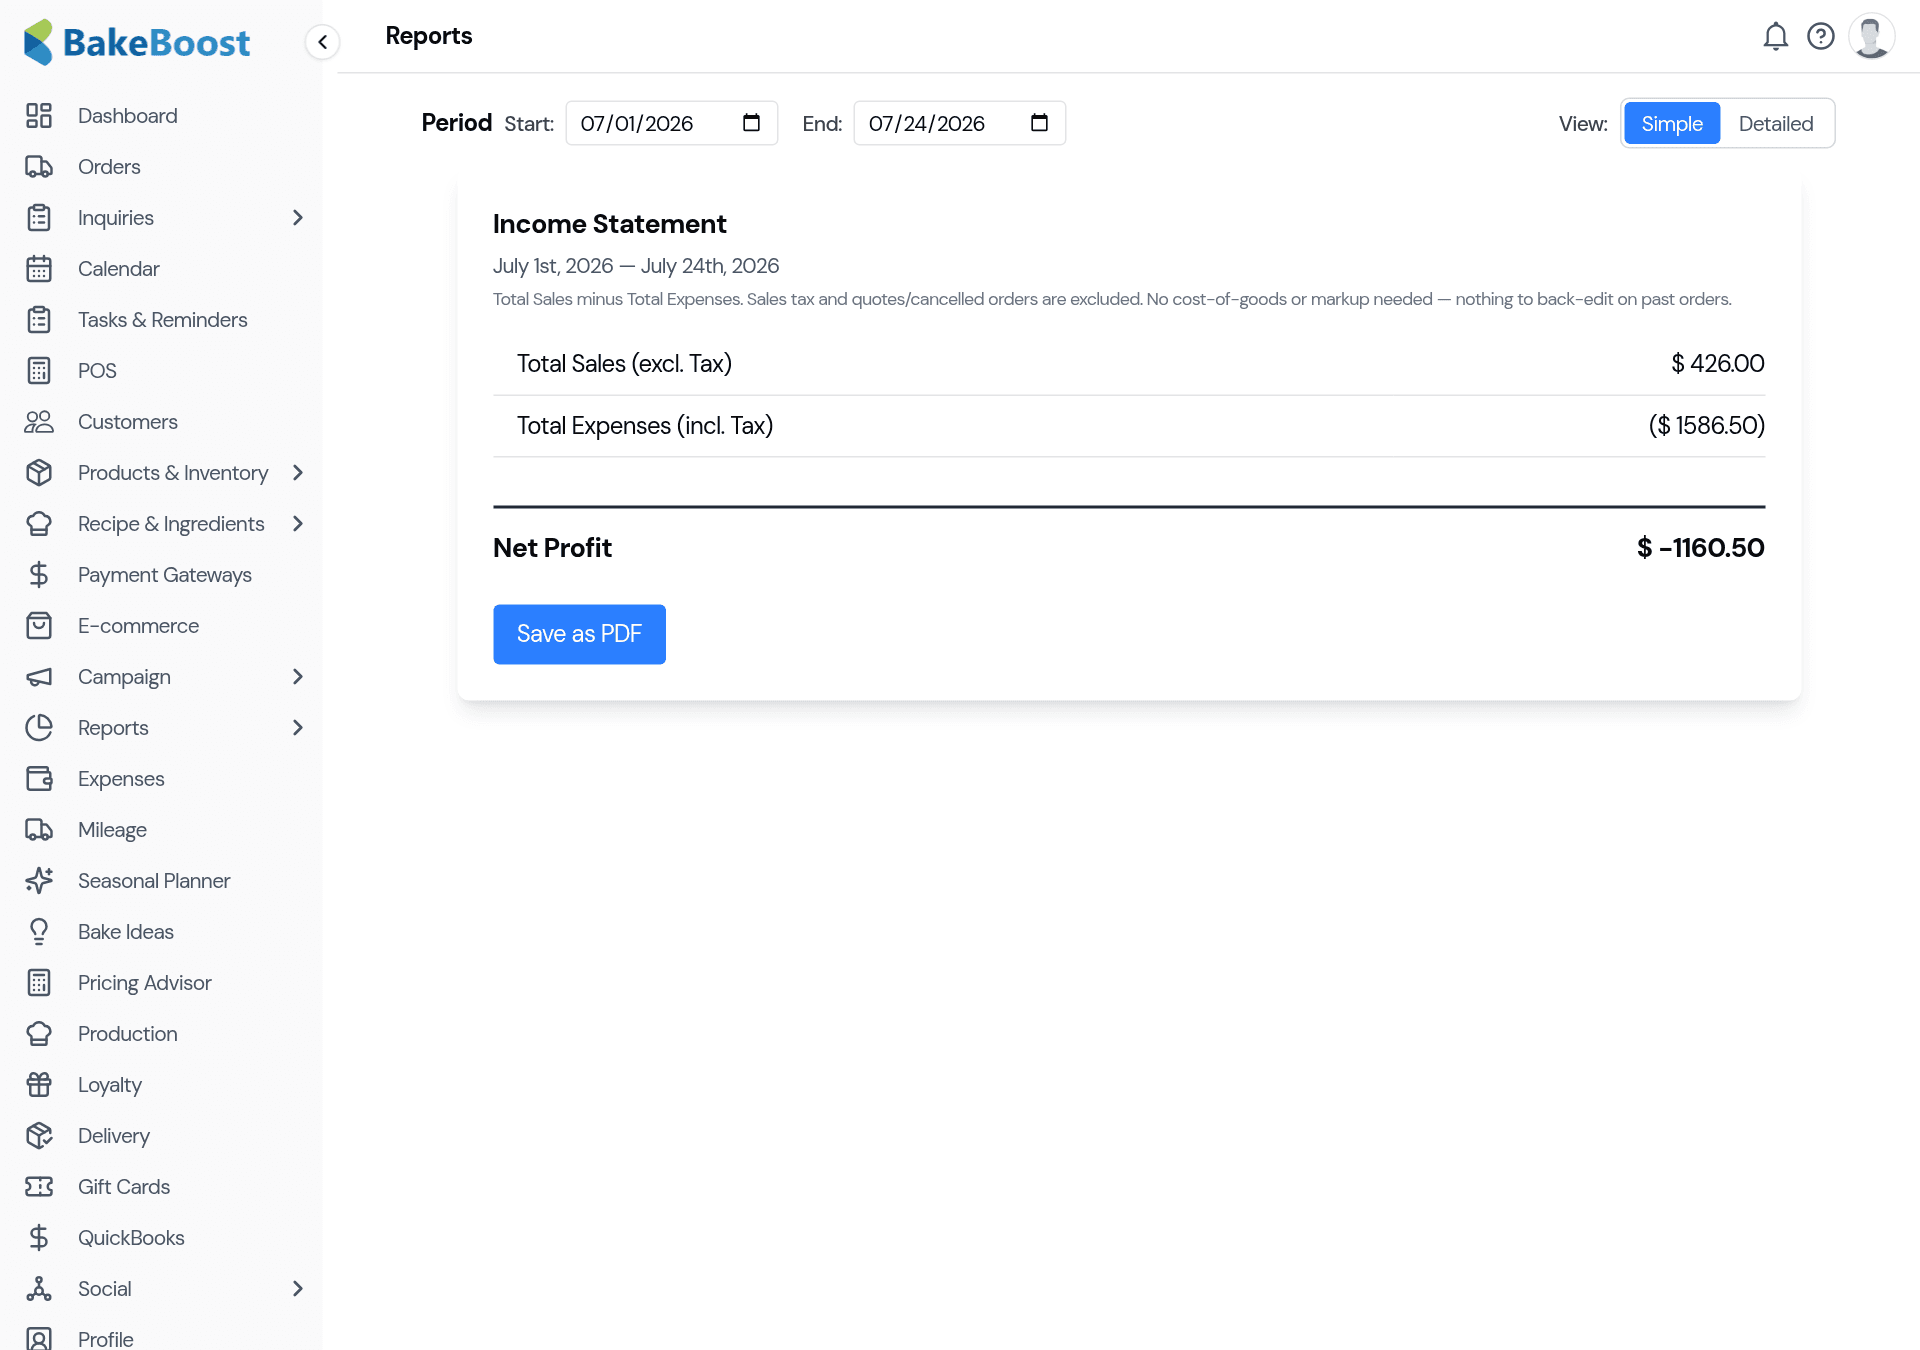
The Income Statement shows the money in and out over a period. Use the Simple view for a clean Total Sales − Total Expenses = Net Profit, or Detailed for a fuller breakdown. Pick your dates and Save as PDF to send it on.
Tax Summary
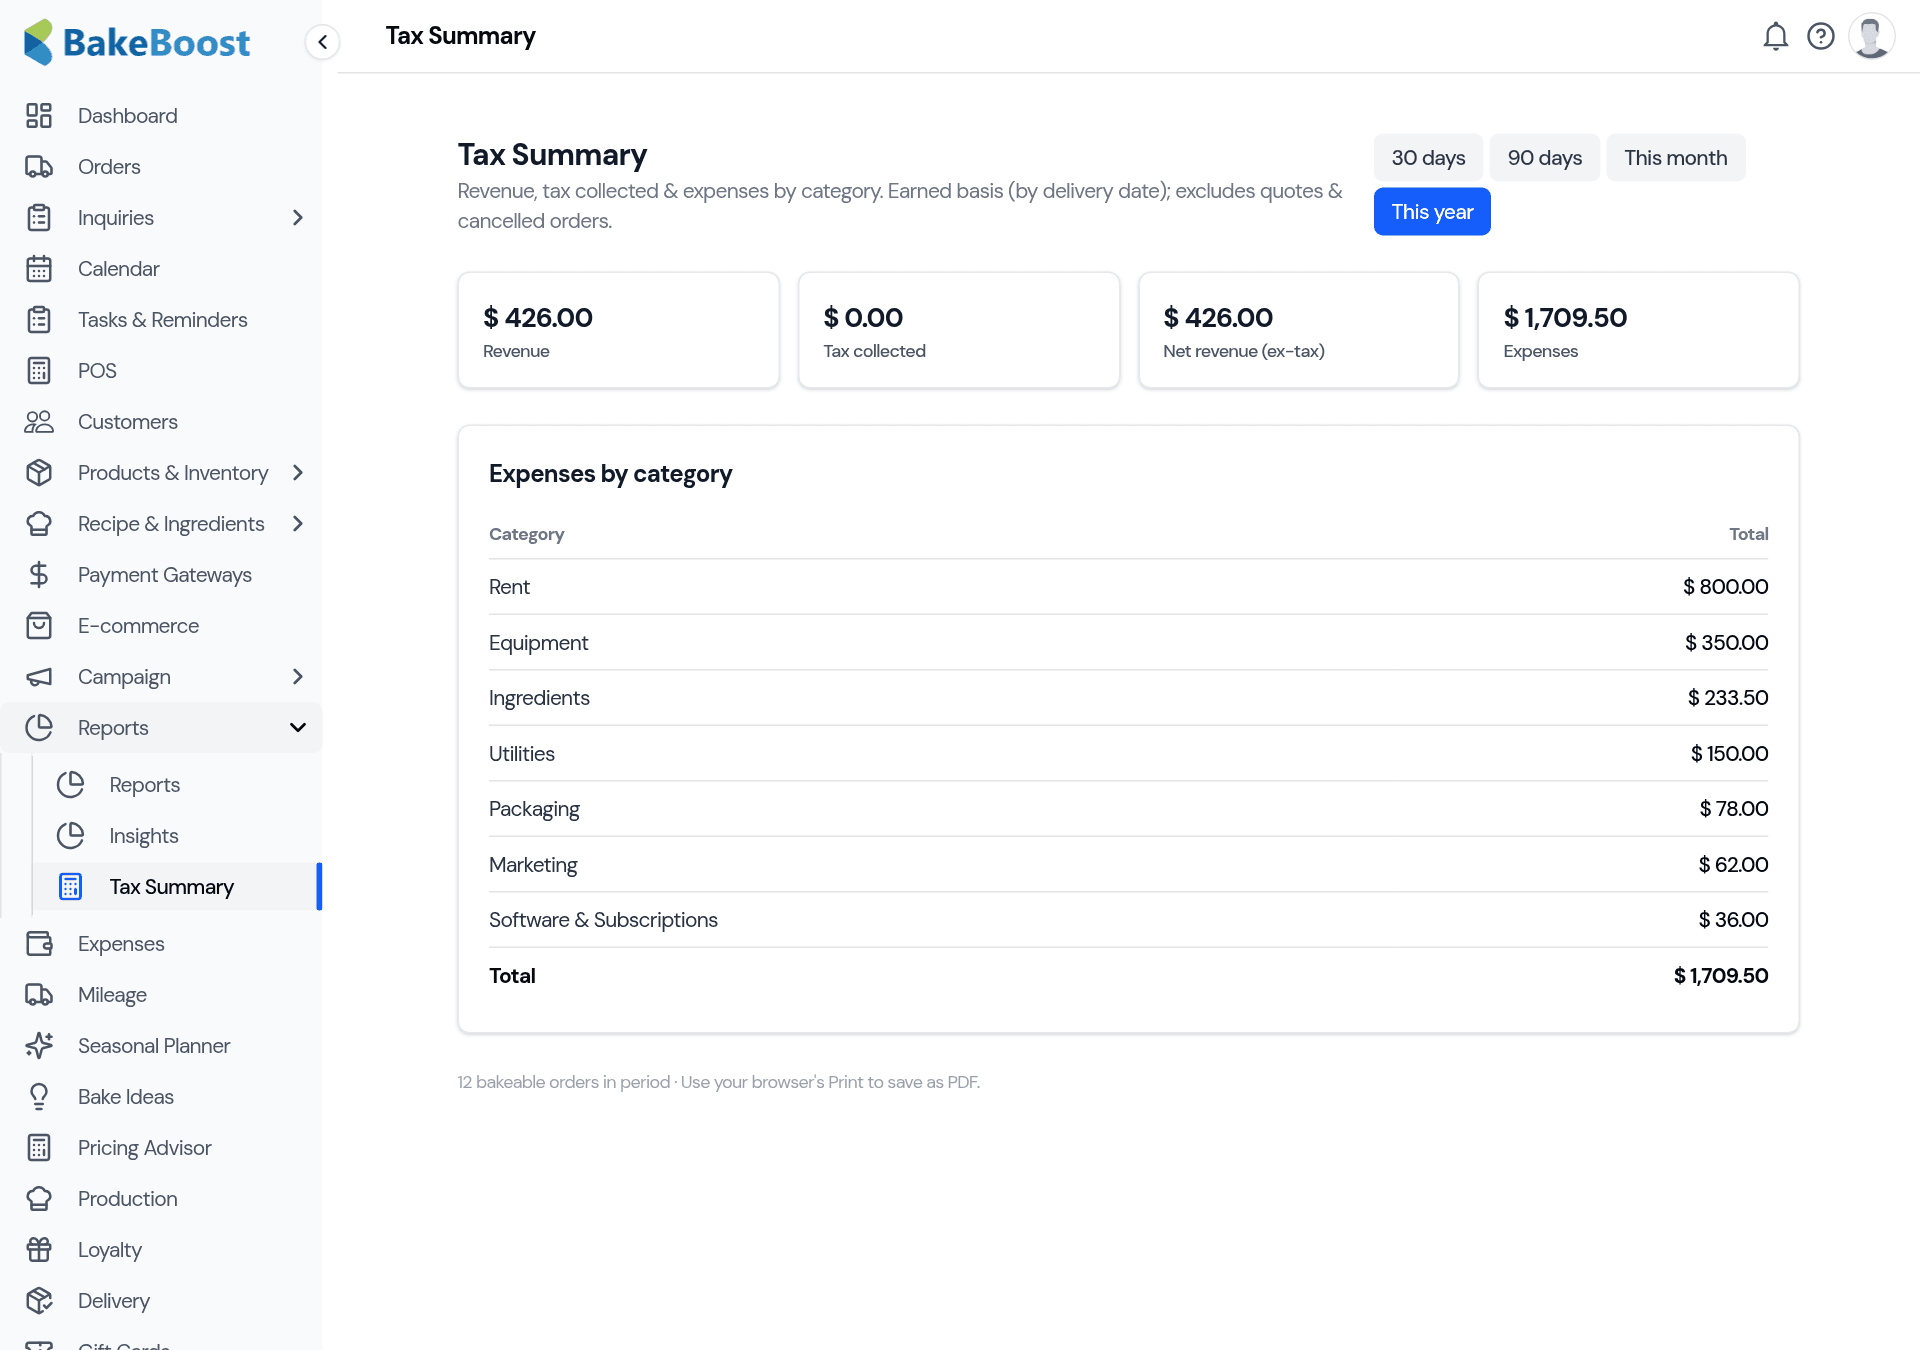
The Tax Summary pulls together the numbers you need at tax time — revenue, tax collected, net revenue and expenses by category — for a quick period you choose.
2. The Insights tab — interactive dashboards
Switch to Insights for visual, at-a-glance dashboards. Where the Reports tab is built for printing, Insights is built for looking — spotting trends, best sellers and warning signs.
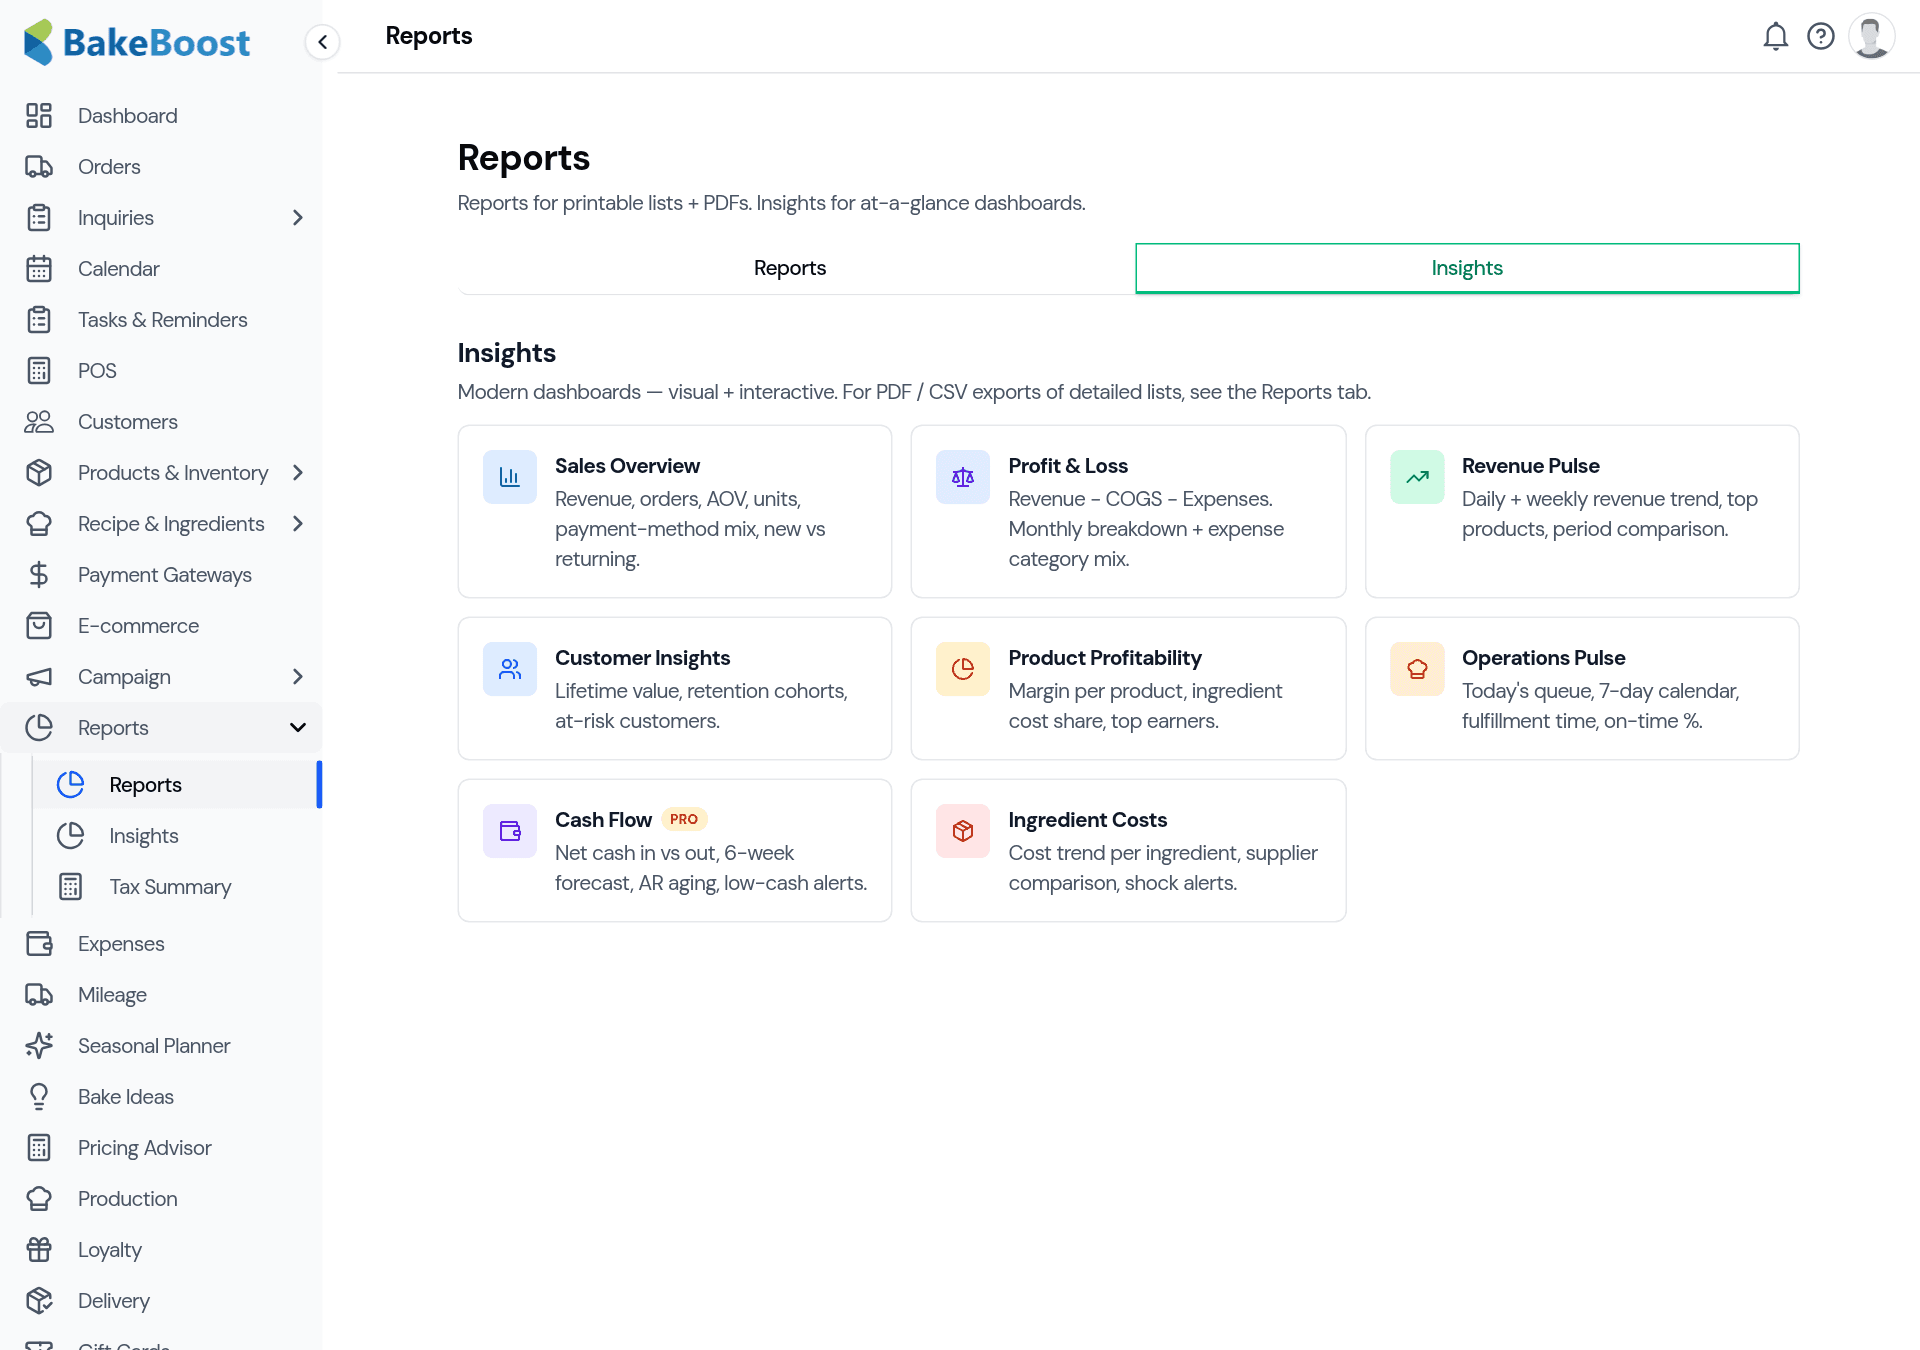
- Sales Overview — revenue, orders and units, and how many customers are returning.
- Profit & Loss — revenue minus cost of goods and expenses, month by month.
- Customer Insights — lifetime value, repeat rates, and customers slipping away.
- Product Profitability — margin per product and your top earners.
- Cash Flow — money in vs out with a forecast and low-cash alerts (see the Cash Flow Dashboard guide).
- Ingredient Costs — cost trends and supplier comparisons.
Good to know
- Two tabs, two jobs. Reports for printable lists and PDFs; Insights for interactive dashboards.
- Everything's driven by your data. The more you record orders and expenses, the more useful every report becomes.
- Export and print. Reports save to PDF (or CSV where it makes sense) to hand straight to your accountant.
- Income Statement has a Simple and Detailed view. Start Simple; switch to Detailed when you want the full breakdown.
Last updated July 24, 2026